Data Visualisation & Analytics
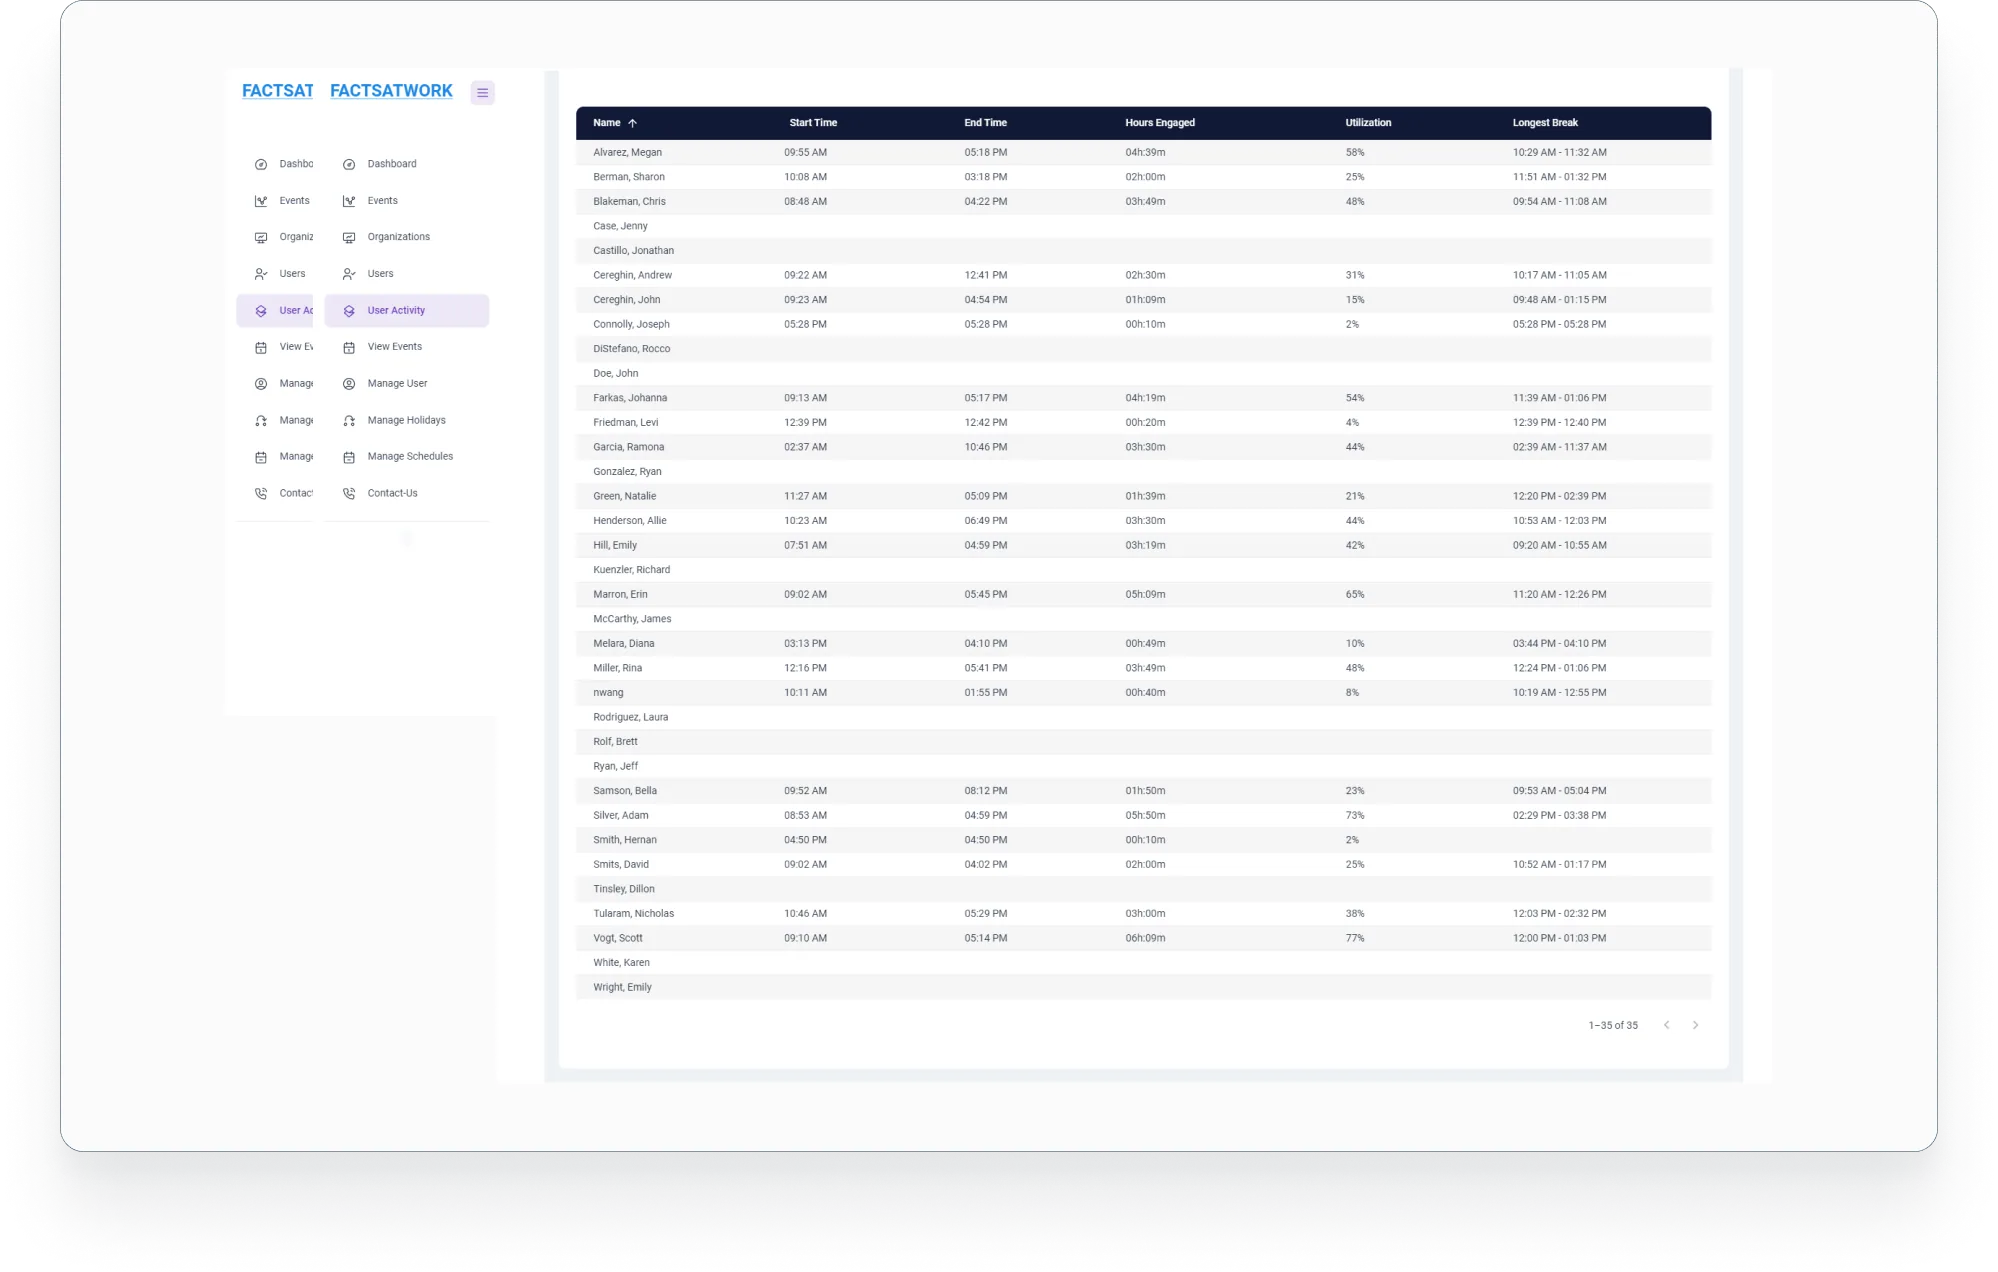
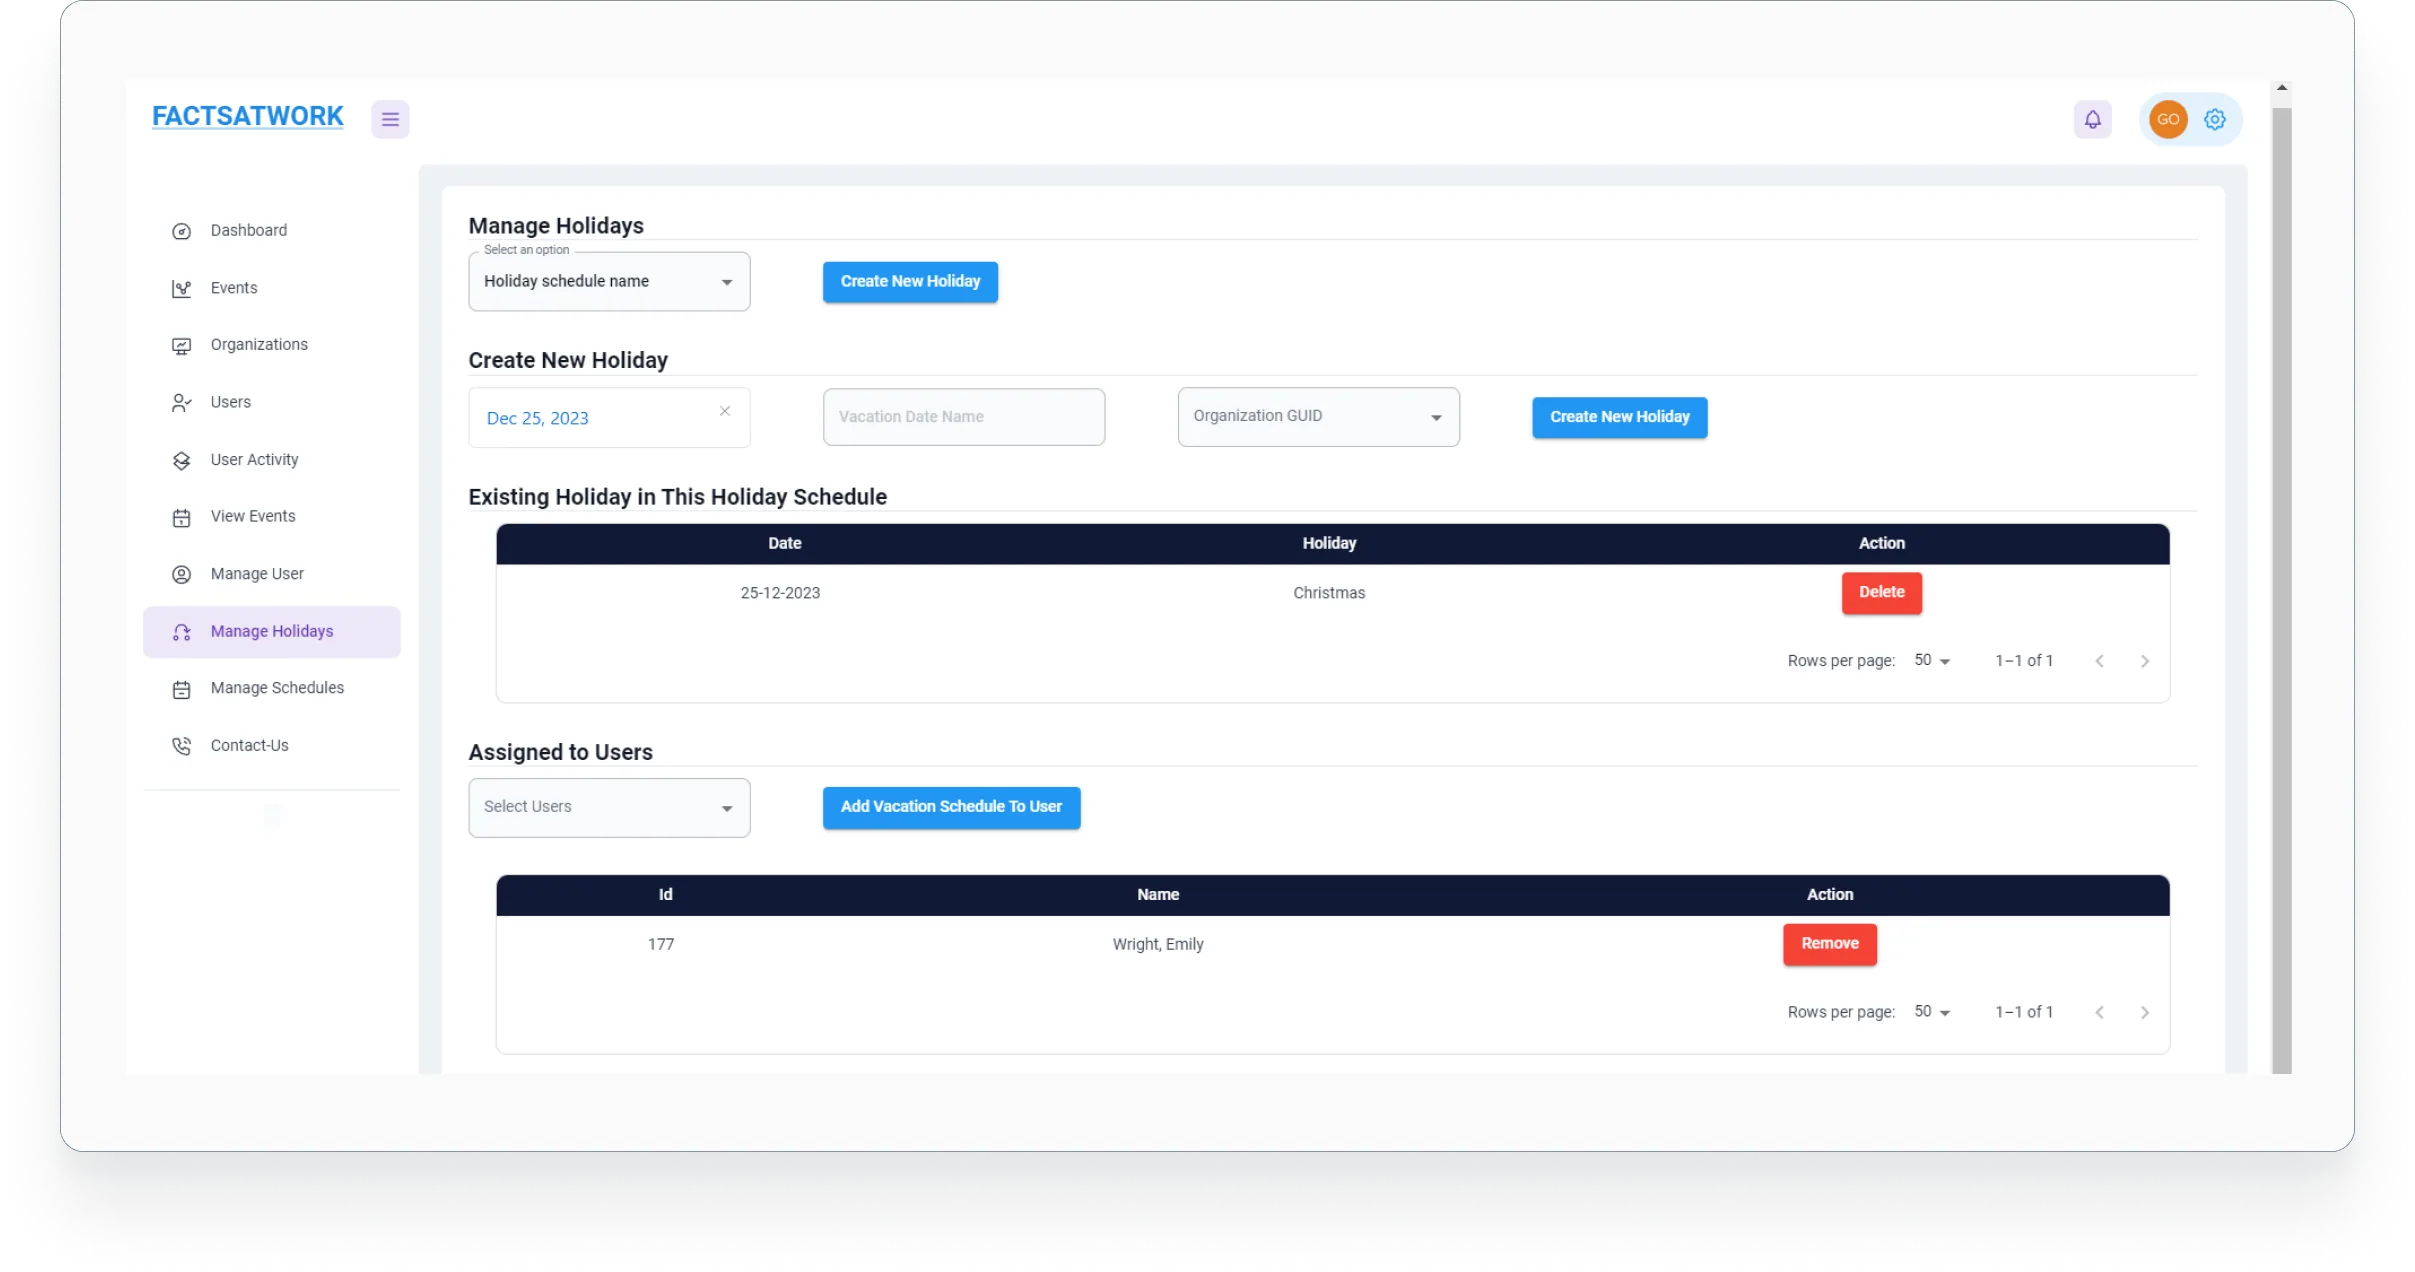
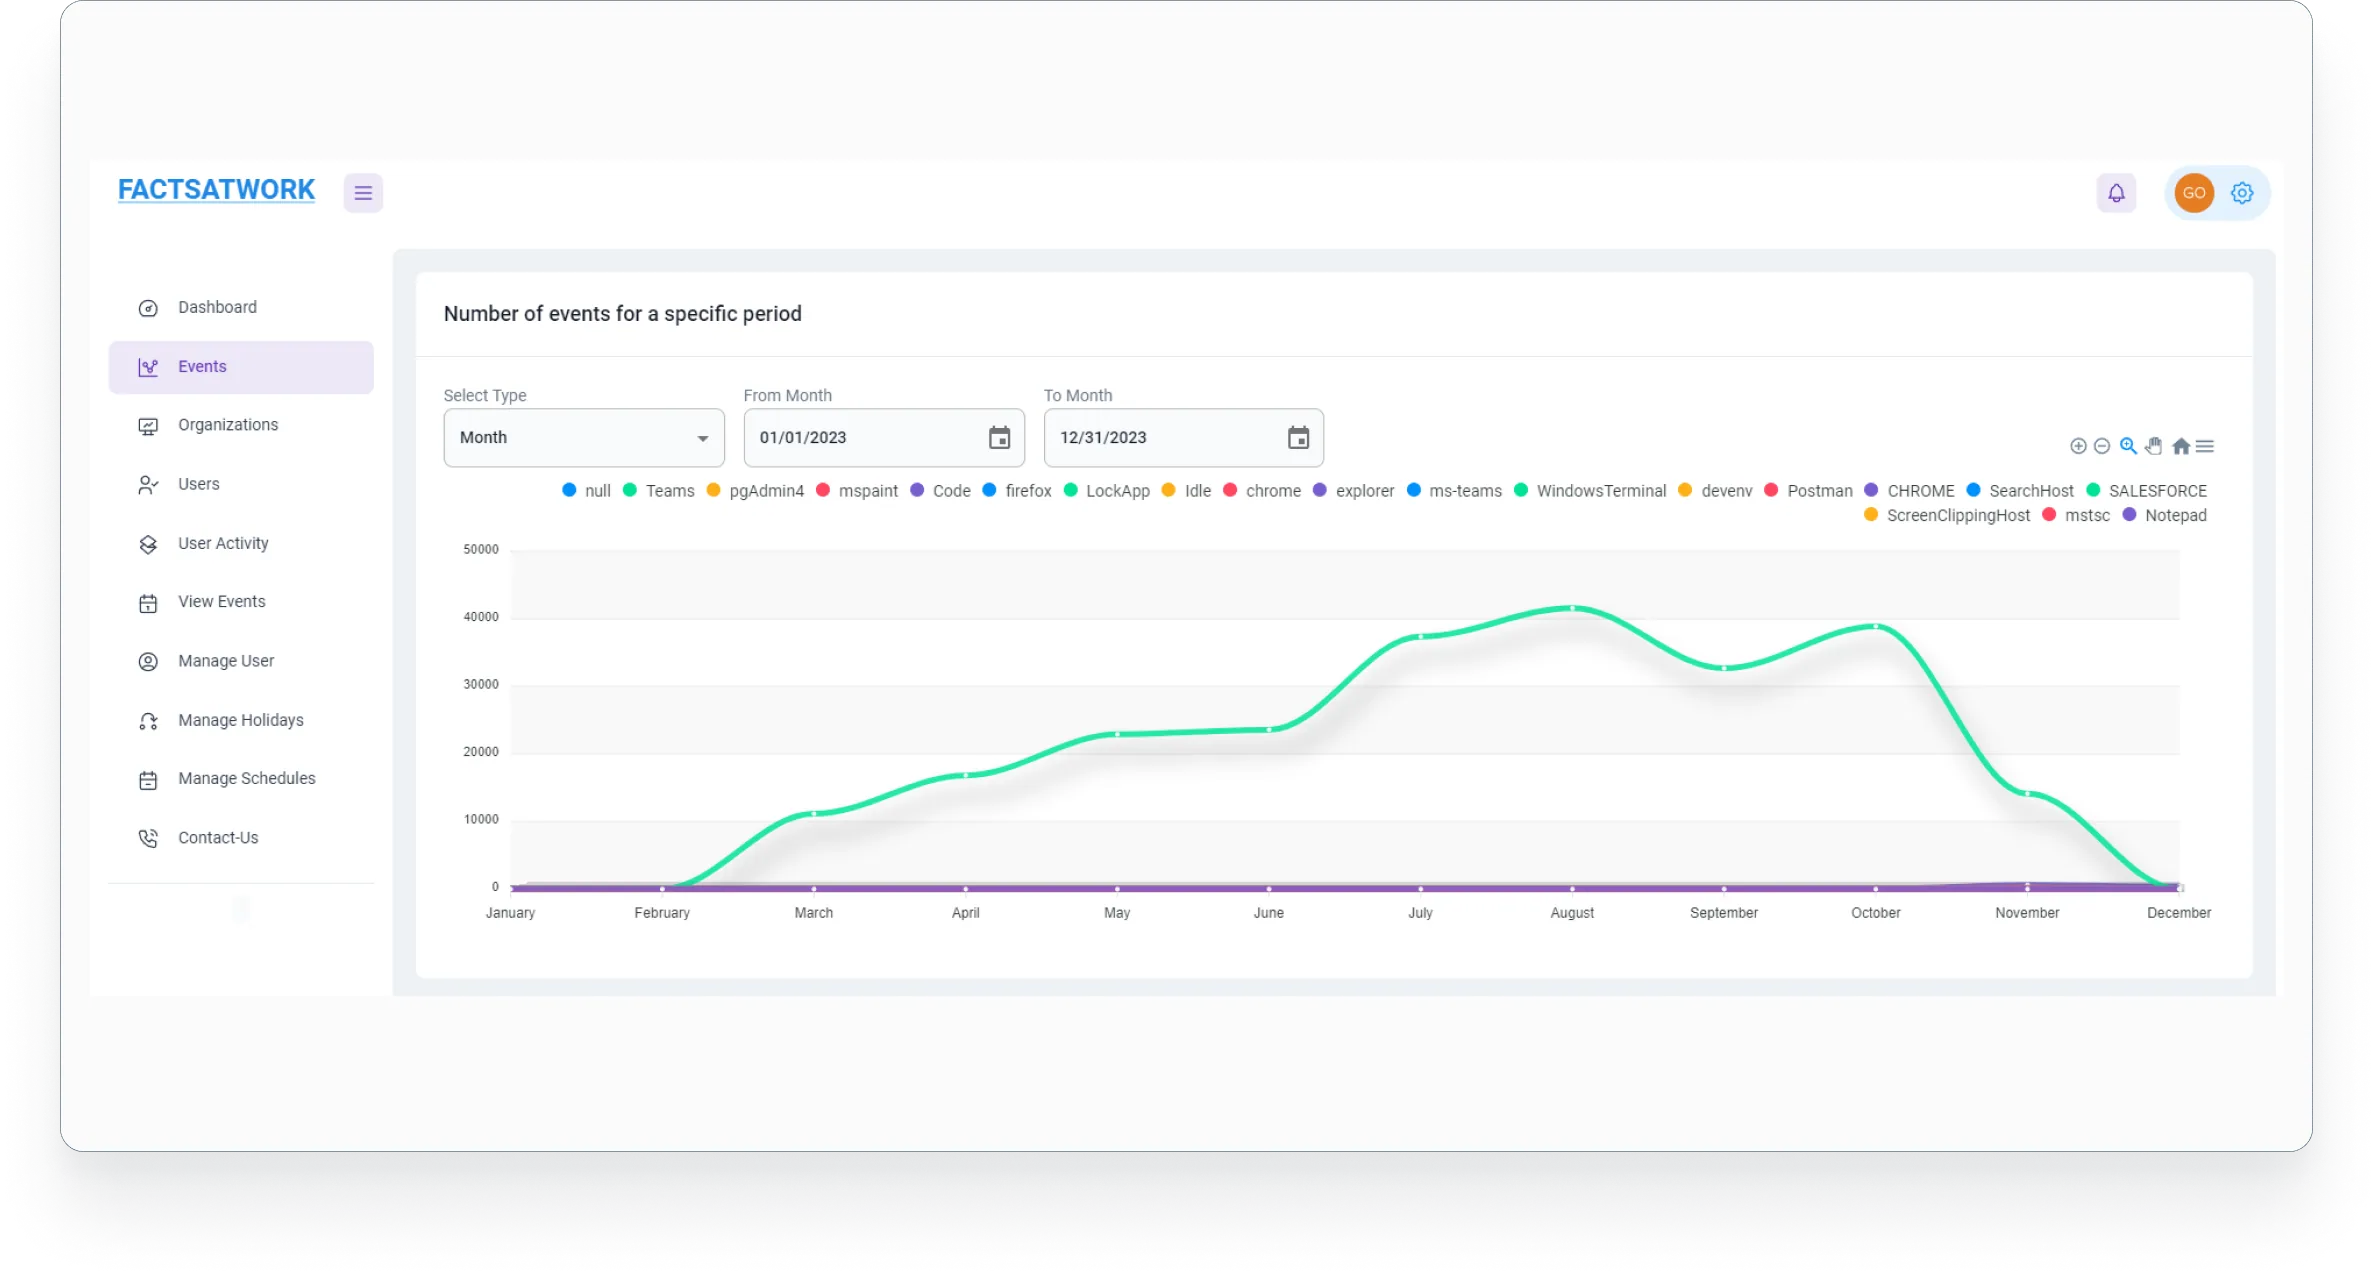
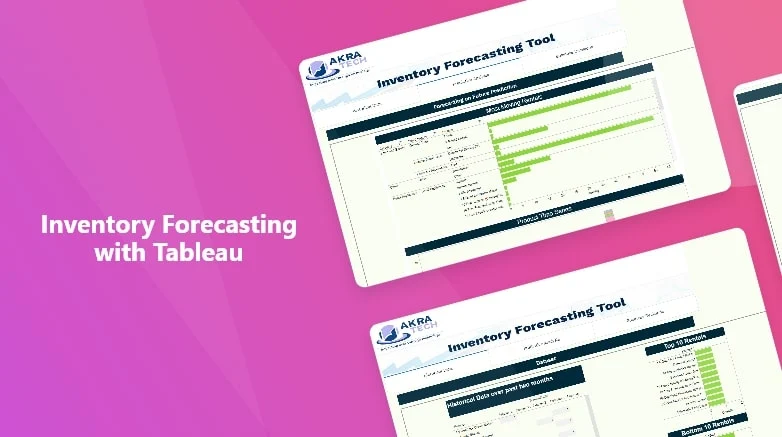
We have created various visualizations using dashboard views for any kind of data representation, through the use of tableau for analytical reporting. We have created a visualisation for E-commerce stores, offline stores and many more. Finally, we deliver clean data in the client’s preferred format.
- Client : xamin
- Category : Data Visualization
- Date : 29/08/2019
We have data visualization expertise to present data in a beautiful and eye-catchy way, and also make it understandable for all viewers.
Now, data can be ingested, analyzed, and translated into a visual representation to make data interpretation easier and more accessible to key players in an organization. Here we have discussed Visual Analytics key concepts.
We have provided insight into solving a problem is displayed in an interactive, graphical manner.Our Visual Analytics can be perceived as an integrated approach that combines visualization, human factors, and data analysis.
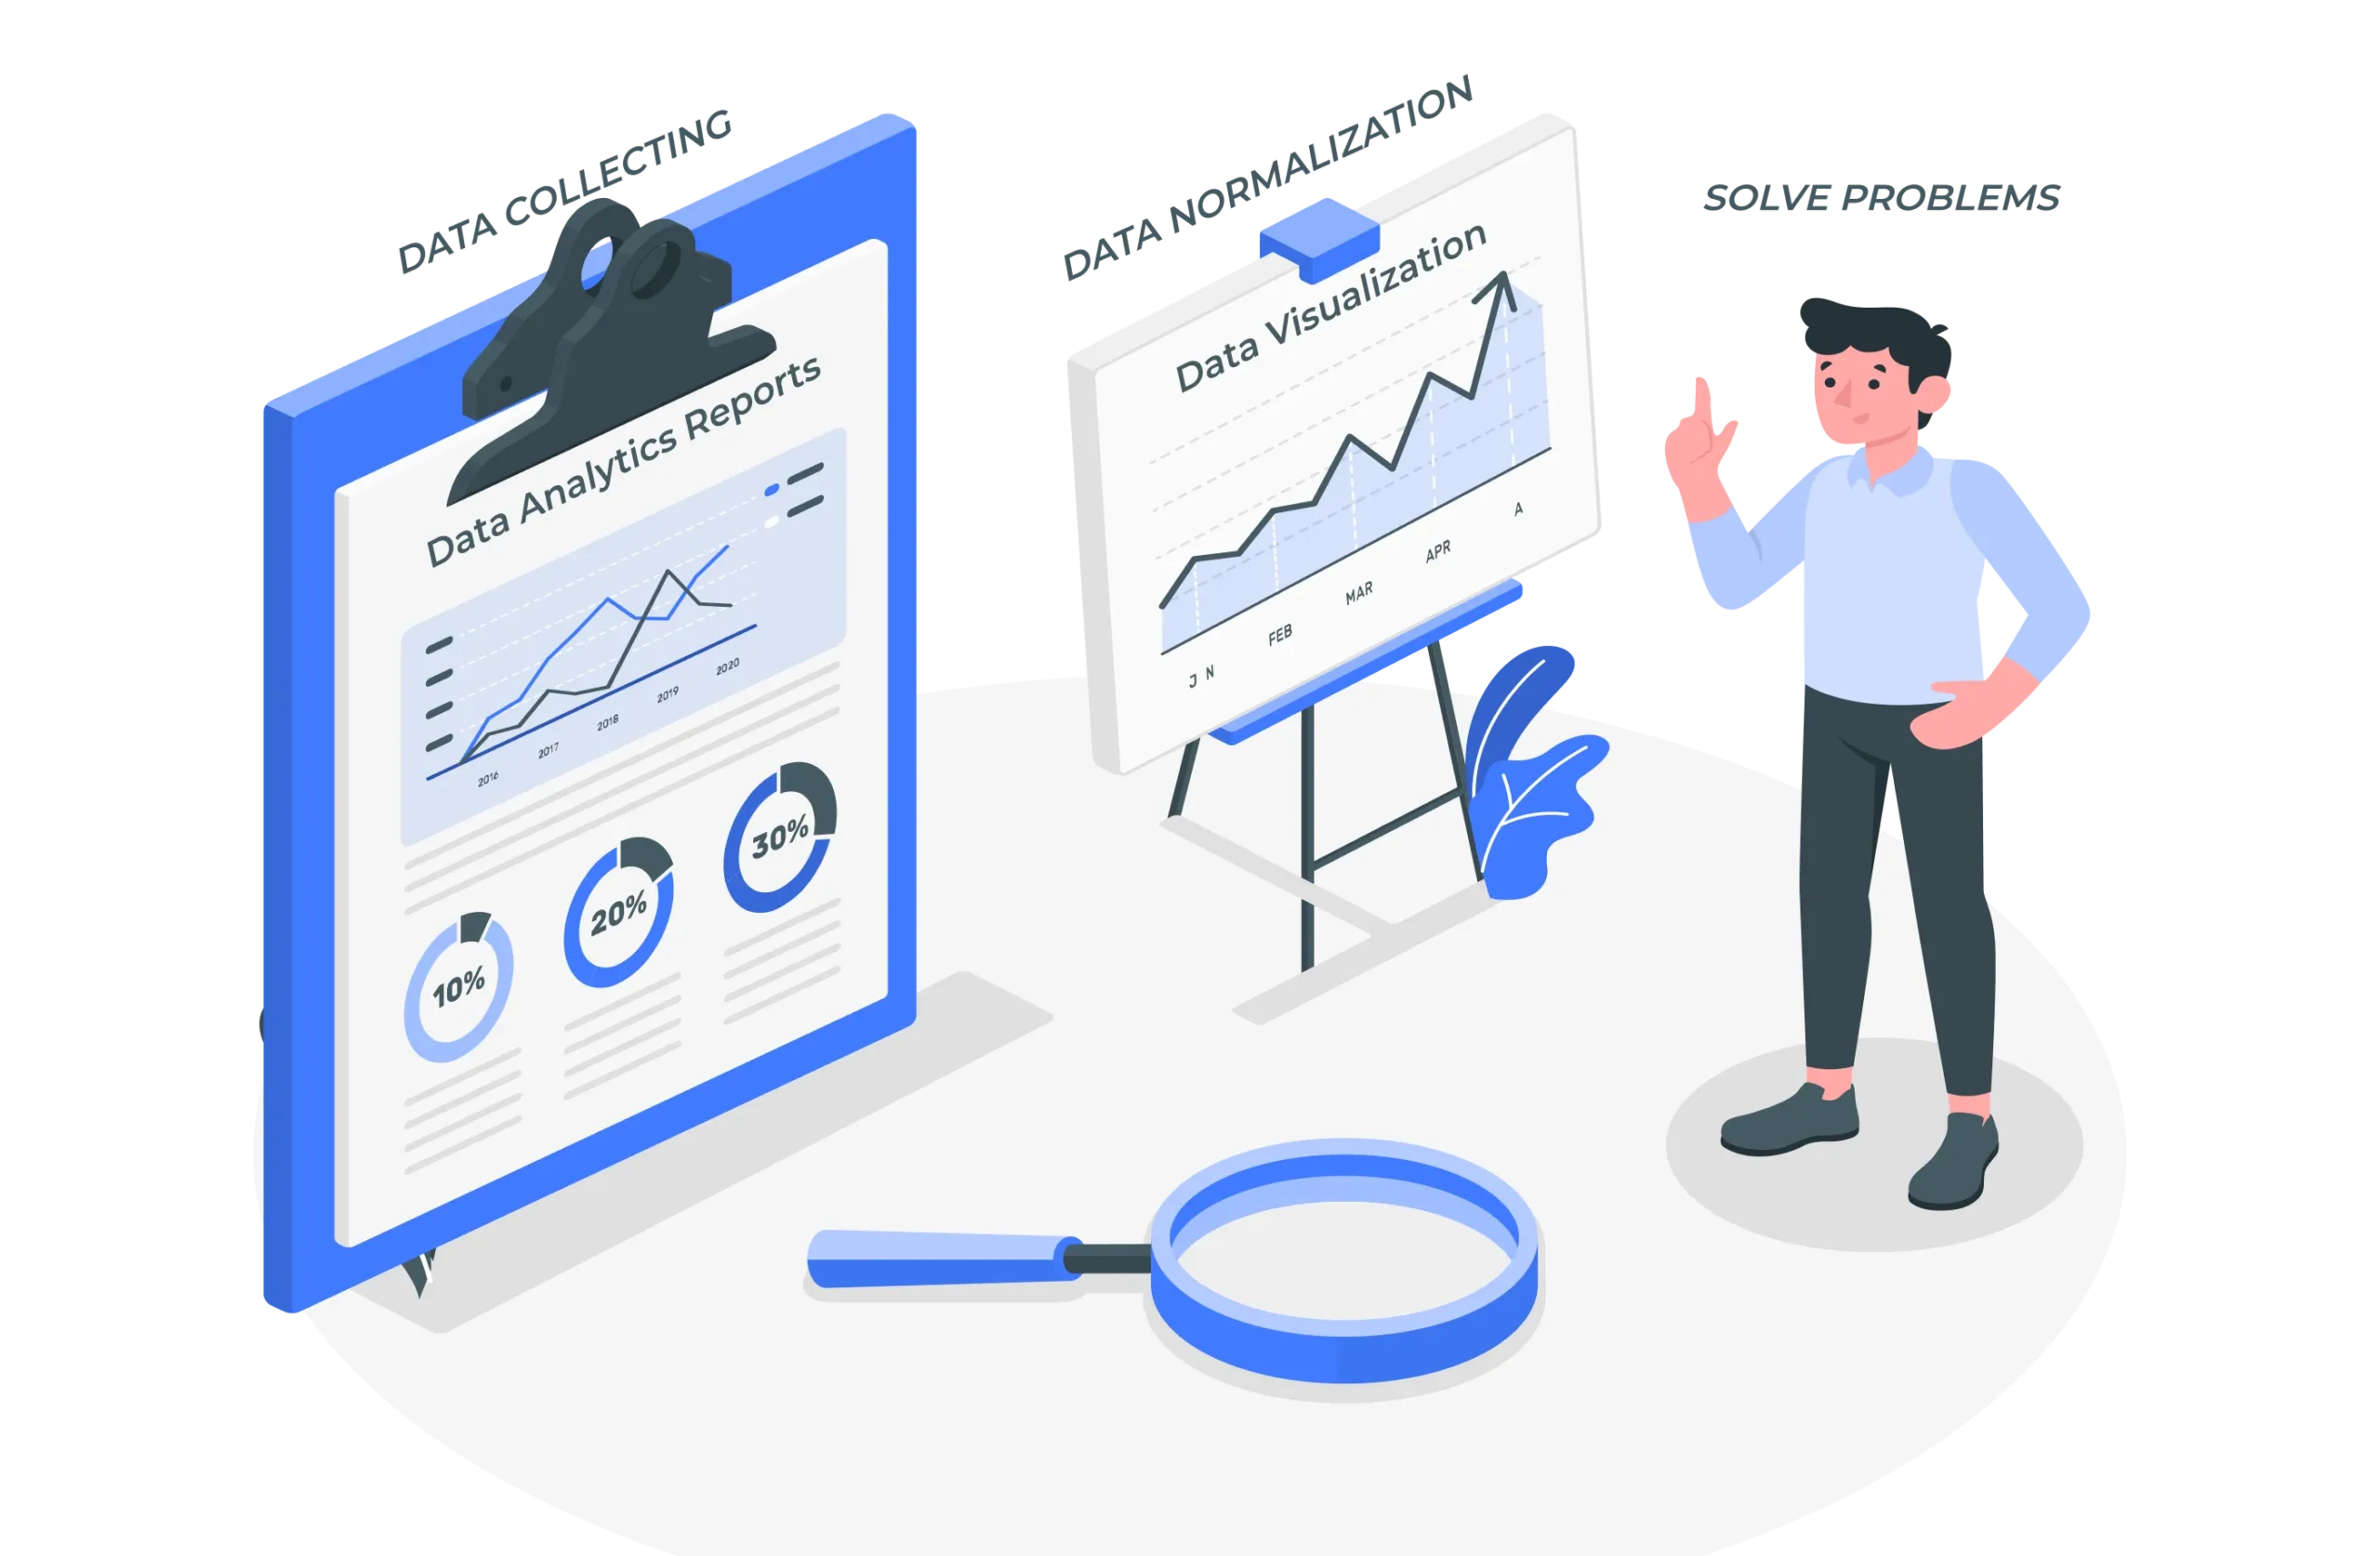
Features
- Solve core business problems
- Strong mental comprehension of high-dimensional data
- Data collection and cleaning
- Data normalization and distribution
For example, the dashboard screens would have different types of engines involving visual graphs, pie charts or infographics tools, where, after computational algorithms work, the results are displayed on the screen.
- Our Visual Analytics interface makes it easy for a human user to understand the results, and also make changes simultaneously that further directs the computer’s algorithmic process.
- Our innovative idea of visual analytics has been the combination of raw algorithmic strength and adept visualization, each one strengthens the work of the other in refining data sets for various goals and objectives.
- We offer Tableau services to help easy-to-use drag and drop interface that can help you quickly turn your data into business insights. The online and server versions allow your entire team to build and work with the visualization tool.
- We also connect to local or remote data of many different formats, connect to live data for up-to-date visualizations
Our Challenges / Solutions
We have prepared Wireframes and Front end design using Adobe XD, Photoshop in coming up with the initial design and mockup and followed by further design revisions
- Design graphic user interface elements, like menus and tabs
- Illustrate design ideas using storyboards, process flows
- Built page elements such custom graphics and illustrations
- Developed UI mockups and prototypes that clearly illustrate how sites function and look like
- Layout adjustments based on user feedback
Our Development Team came up with the technical architecture followed by data flow design, process flow design, flow charts, and technical documentation
We used PHP Tech Stack with Application Programming Interfaces (APIs) which let “Plug in” to other Useful Features. Through our highly skilled and certified developers, we developed custom solutions and technical services on a wide range of requirements and thereby exceeding the client’s expectations. This has all been achieved through our efficient coding best practices, development processes, implementation guidelines, technical maturity & end to end delivery.
We performed a comprehensive test strategy since technology stack undergo constant changes due to upgrades in web and mobile technologies. Our testing included exhaustive functional and non-functional testing, manual and automation testing besides performance and security testing. Our automated Application Testing and Performance Analysis ensured testing the applications on multiple devices and form factors and make the testing process quick, efficient, reliable, repeatable and reusable.
Our comprehensive application testing coverage included the following:
- Functional testing including UI testing for native, hybrid and web applications
- Cross Browser Testing across various browser platforms
- Cross platform testing: iOS, Android, Windows, BlackBerry and HTML5
- Non-functional testing: Performance, stability, security and compliance
- Usability and compatibility testing

Ankit Chaudhary
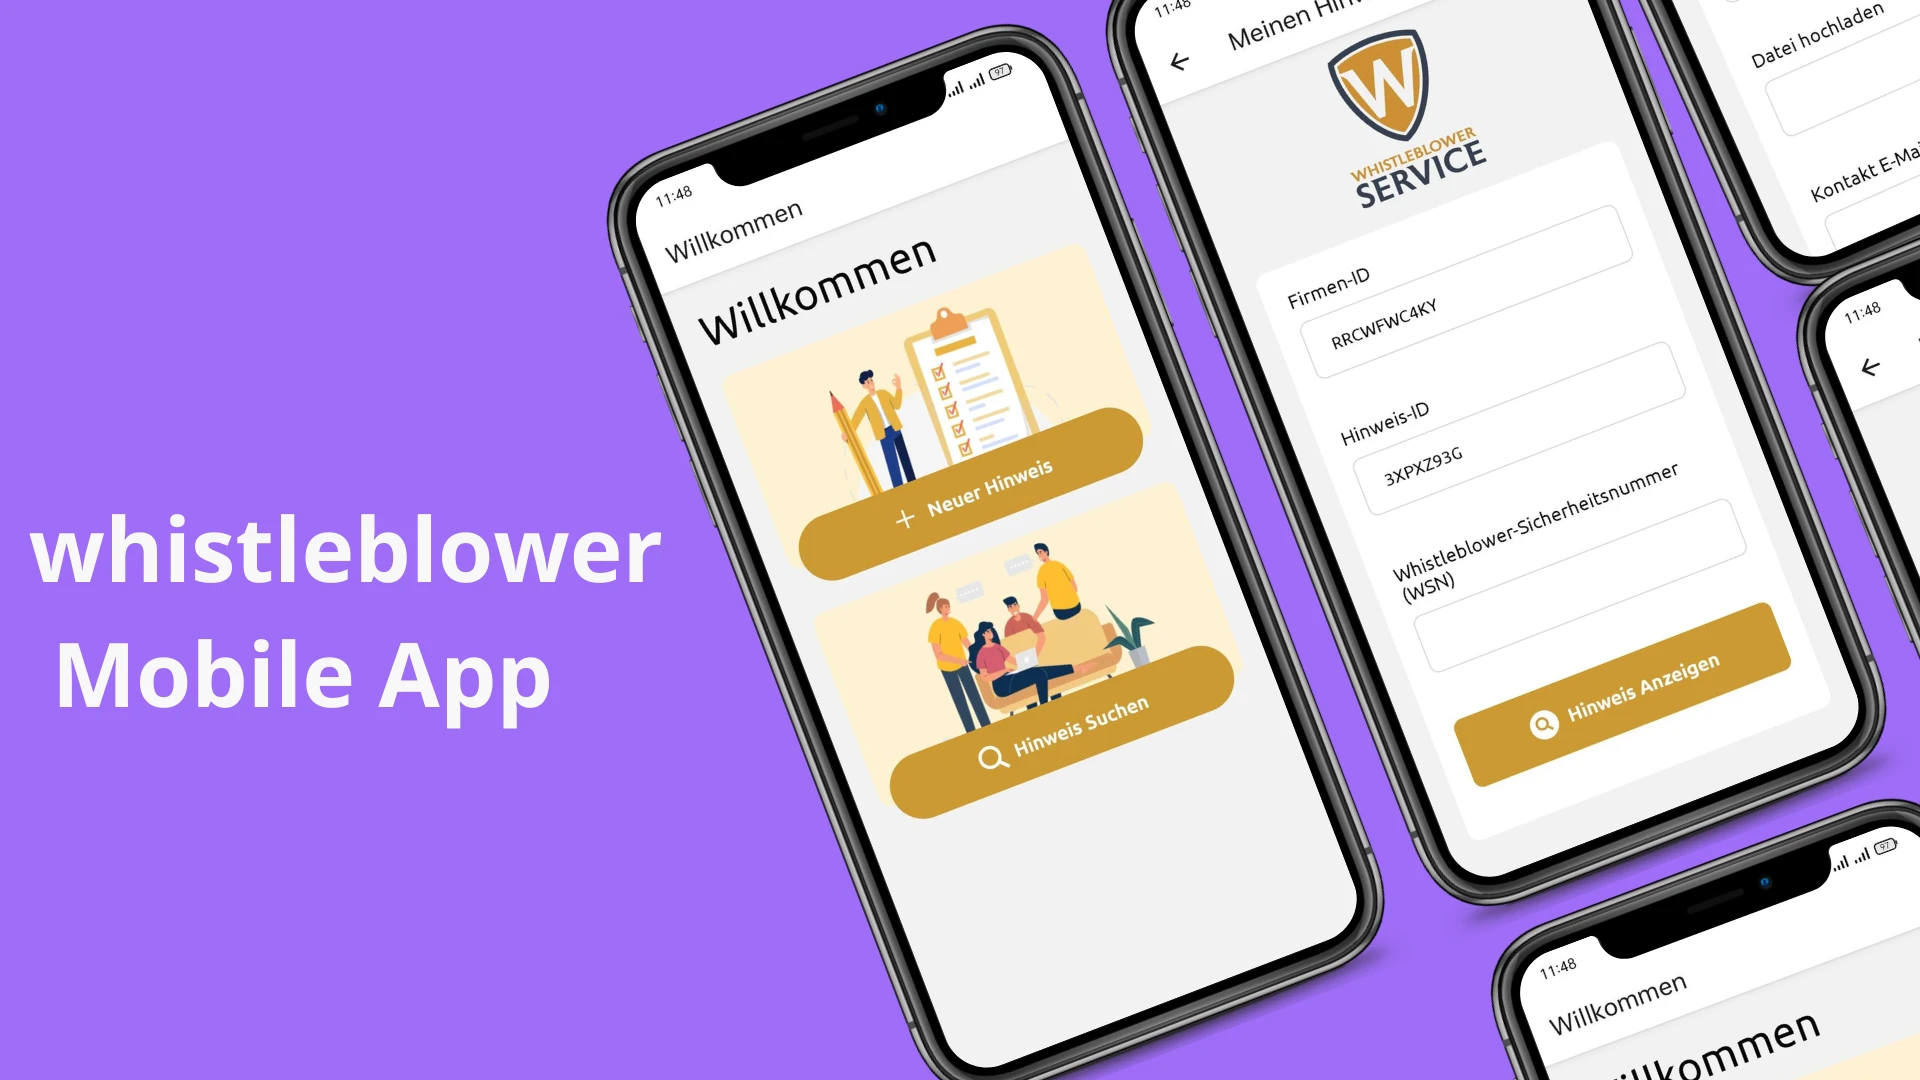
- Sr. Full Stack DeveloperAnkit showcased impressive Full Stack PHP skills while working on the Whistleblower Application from start to finish, and his communication was top-notch. He played a key role in getting the application delivered smoothly from the very beginning to the end.”
Tim Prinz
Whistleblower App

Abdullah
- Python DeveloperAbdullah did a fantastic job with his Python development assignments and effectively added the security feature for website scanning. As a valuable member of the Akratech Team, he contributed greatly, and we wish him and the entire team all the best!
Tim Prinz
Privacy Scanner

Munish Kumar
- PHP DeveloperWe have worked together for almost two years, and he was consistent and did his job to the best of his ability. Startups have a lot of moving components and he was able to navigate successfully.
Jaya
We Intervene

Kareem Ghuneim
- UpworkAshraf did a great job holding my engineers to the strict deadline, very friendly and accomplished everything I needed him to accomplish
Rajinder Kumar
- Sr. PHP Laravel DeveloperRajinder is a skilled developer with great communication skills. I enjoyed working with him on this job
Avery Pawelek
Datenschutz Prinz GmbH

Sandeep
- Python DeveloperSandeep is a solid developer who communicates well. He was very quick to address any feedback requests and worked hard to get the job completed at a high level.
Avery Pawelek
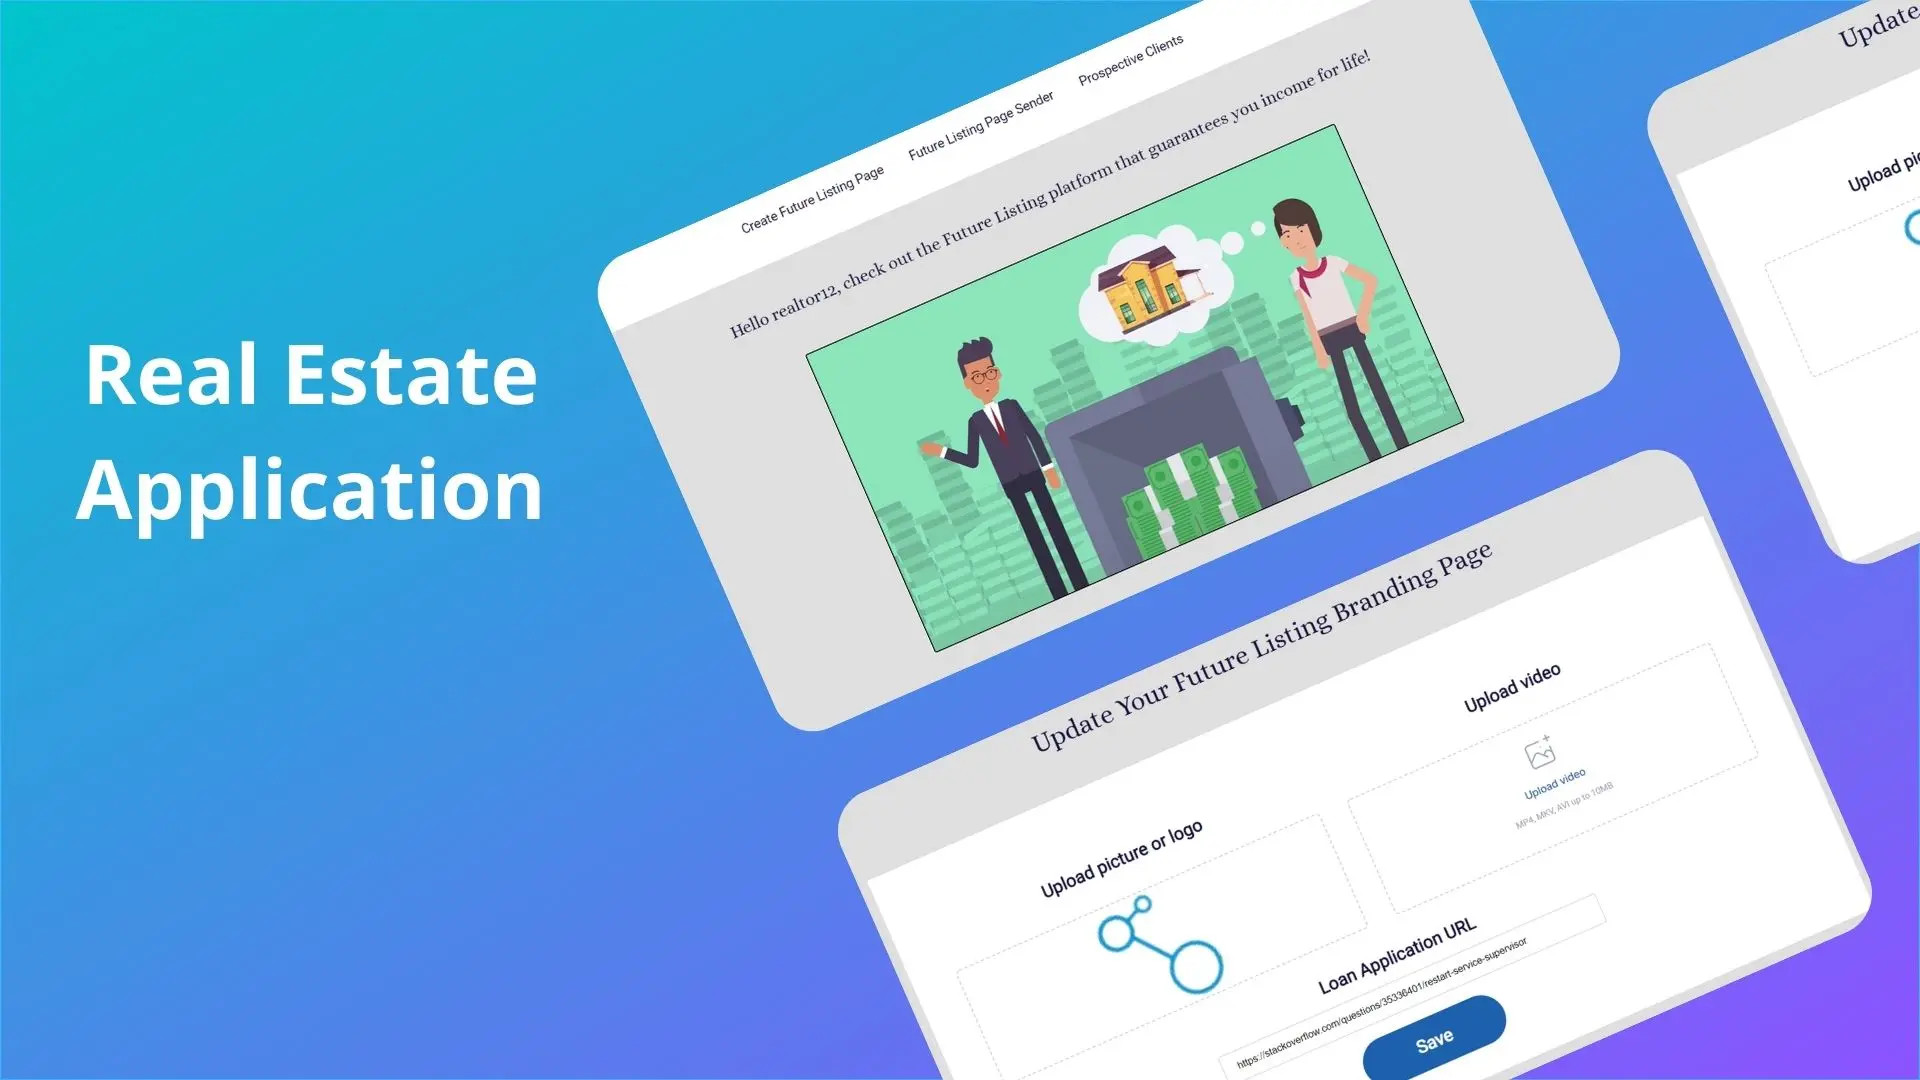
Real Estate App
Rajinder Kumar
- Sr. PHP Laravel DeveloperExtremely professional and competent. Responsive, knowledgeable, and a pleasure to work with. Would definitely recommend Raj and hire him again.
Bruno Cardoso
We Intervene

Rajinder Kumar
- Full Stack DevelopmentIt was an absolute pleasure working with Raaj. He is very attentive to details, communication skills are really high and made everything so much easier. Raaj completed work very quickly and was able to help out in the process where we were unfamiliar with generally accepted practices.
Tim Prinz
Datenschutz Prinz GmbH

Ahmed Marjeby
- upworkGreat talent. Delivered the work in a timely manner and was always available to accommodate our requirements. Well done!

Ankita
- Project ManagerAnkita is great to work with and I am super happy to have the opportunity to work with her.
Natasha Green
We Intervene

Gulab Chopra
- Full Stack DeveloperOver the past four years of working with Gulab, we have found him to be highly professional, dedicated, and committed to his work. He consistently provides realistic timelines and ensures that deadlines are met. His attention to detail is exceptional, Gulab handles full stack development with ease and his expertise in React, JavaScript, and UI development is particularly impressive. His code is always well-organized, and his problem-solving skills are excellent. He also shows no hesitation when tackling research and development-based challenges. Overall, Gulab is a valuable asset to any team, and we wish him the best in all future endeavors. Good luck with your upcoming projects, Gulab!
Jayalakshmi Rajasekaran
FTC Solar

Manish Kumar
- PHP DeveloperManish has truly excelled in his work, showcasing impressive skills in PHP front-end development. I recommend him for any front-end design and development projects. His technical abilities and communication skills are outstanding.
Tim Prinz
Privacy scanner

Ricardo Vidal
- PhDHead of Product“We hired a project manager from Akratech for an MVP launch. Not only did we stay on schedule, but the manager’s deep expertise in Agile helped us trim 30% off our (more…)

DANNY GLENNON
- CEO -PtbizfitAsh is extremely knowledgeable in his field, he helped our team streamline and accelerate software development faster than we could’ve imagined. His English is fluent and he is super friendly to speak with. Ash has great insight on industry best-practices, has a personalised plan for our project and was very considerate when it came to saving on cost where possible and not only making the project under budget but quicker to develop too. I would recommend Ash any day of the week, he’s a great asset to any team.

PAUL D
- CEO -FleuronguideGlad to have found this contractor, up till jow splendid job done.This contractor debugged very quickly and correctly the problems which occurred. We will re-contact him if course when other necessities very satisfied with a job well done, correct and quickly solved.

ERIKA MARTINEZ
- CEO - Denver Public School“Extraordinary professional! It has been an honor to work with some-one of his calibre. He is deliberate with his project management tactics and implements with great attention to every detail. For me, one of his most important skill sets is his ability to self manage and keep our projects moving forward no matter my availability or the lack thereof. No worries once you have agreed on a gameplan and a course of action. Additionally, Ash puts his heart and soul into his work. He gives you everything he’s got when he gets into a project. I am humbled to have worked with some-one of such high integrity and so committed to our mutual success. A truly great business partner.”

JOEL
- CEO - ACME ProductionsAsh completed the task perfectly within a few hours of posting the task. He knew exactly what he was doing and was a please to deal with. Will definitely keep in mind for future work

DR HISHAM AL DABAH
- CEO
JOSEPH RICE
- Sabaa.org, USA
Natasha Green
- Founder | WeInterveneI am thrilled to share my experience with Akra Tech, a company that has been instrumental in my EdTech startup, We Intervene, since July 2020. (more…)

Aida Ahmadzadegan
- CEOAKRATECH was able to help my startup to build an MVP very quickly and they helped me to turn that into my first product which looks quite well. (more…)
Recent Portfolio
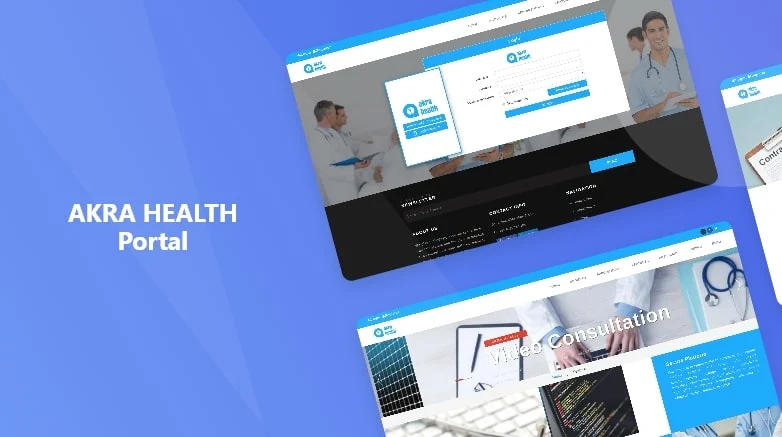
Akra Health Portal
SAAS
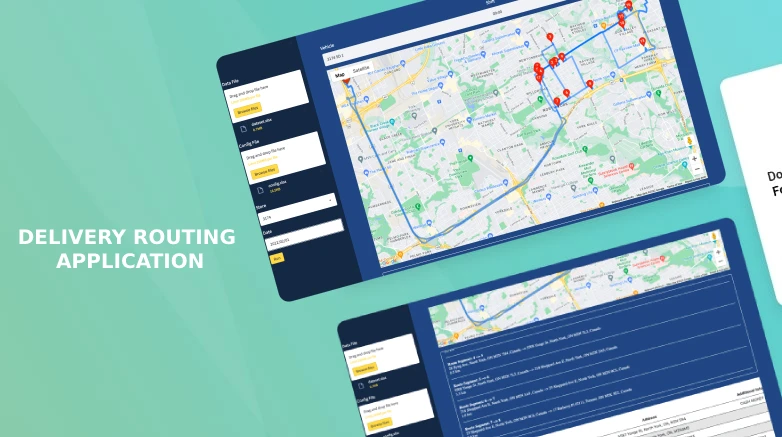
Delivery Routing Application
Data Science
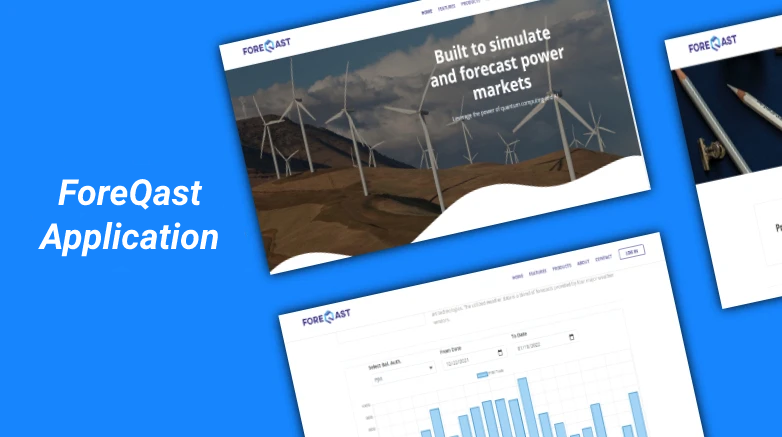
Visual Forecasting
SAAS
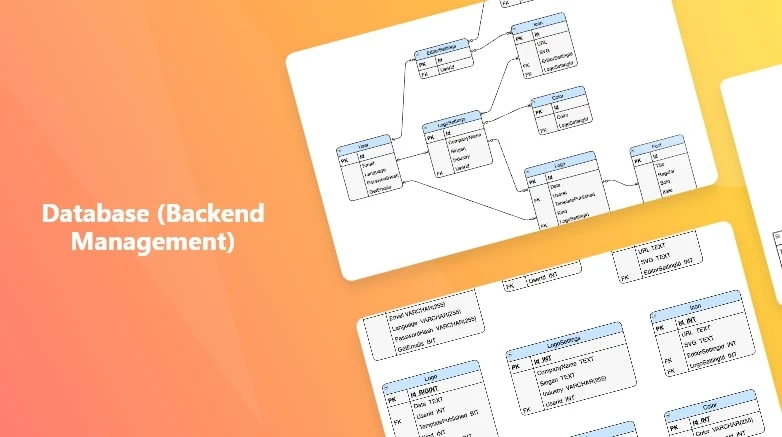
Database (Backend Management)
Healthcare
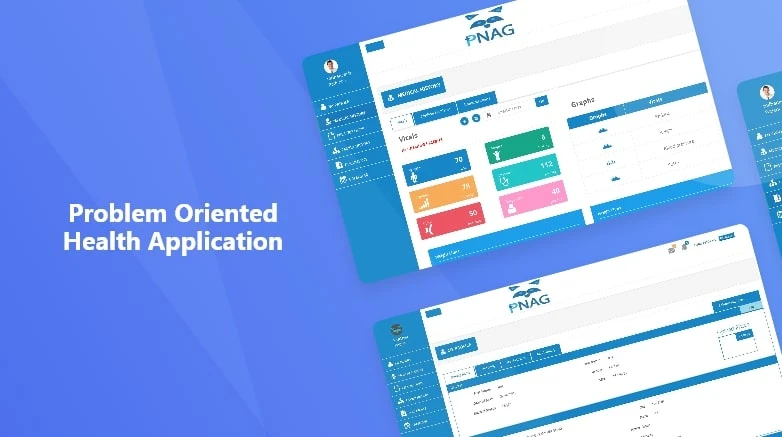
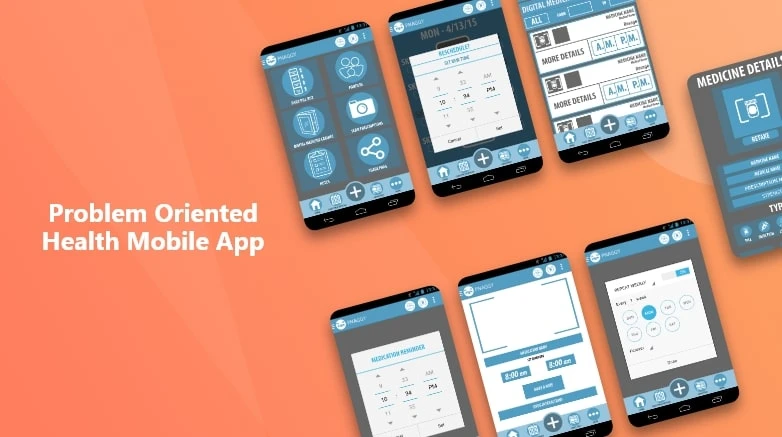
Problem Oriented Health Application
Healthcare
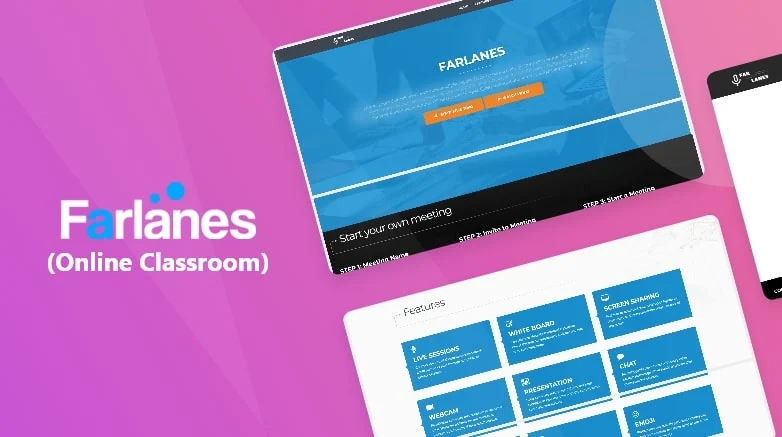
Farlanes Online Classroom Mobile Application
Healthcare
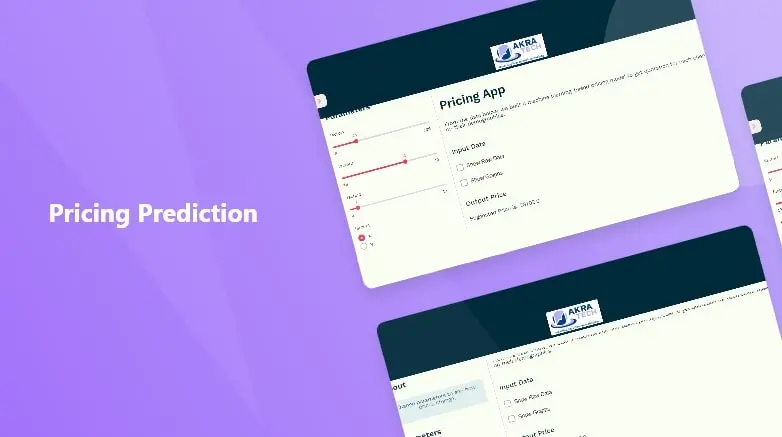
Pricing Prediction
SAAS

Web Scraping with Python
Data Scraping
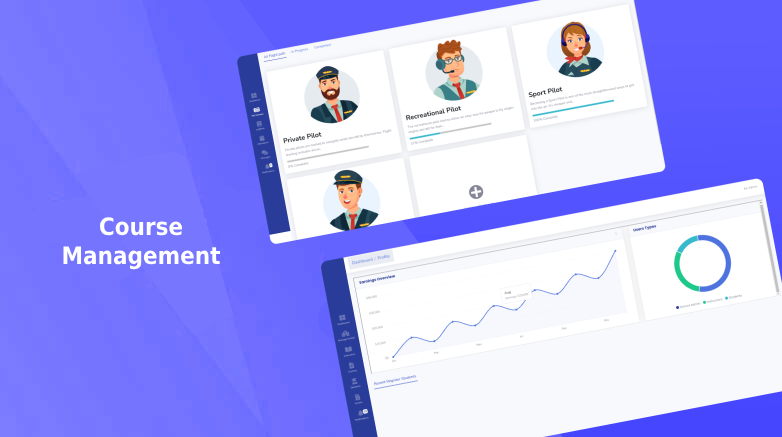
Course Management
Data Scraping
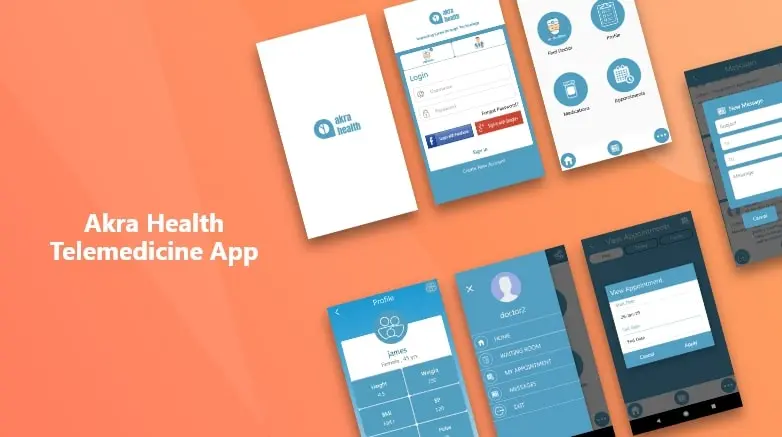
Akra Health Tele Medicine App
Healthcare
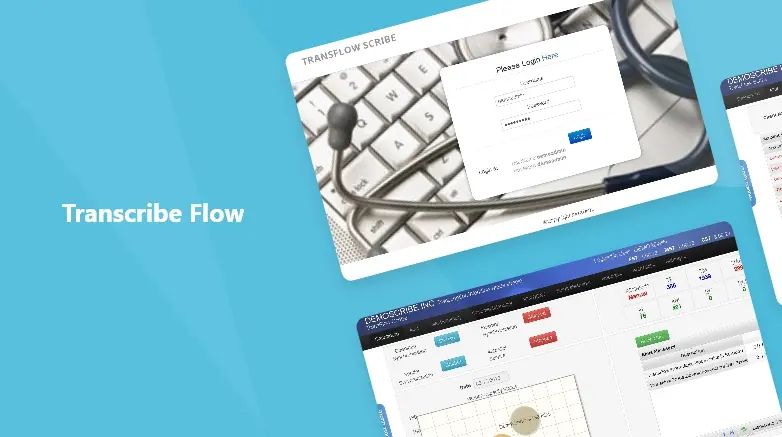
Transcribe Flow
Healthcare

Gift Pool
E-commerce
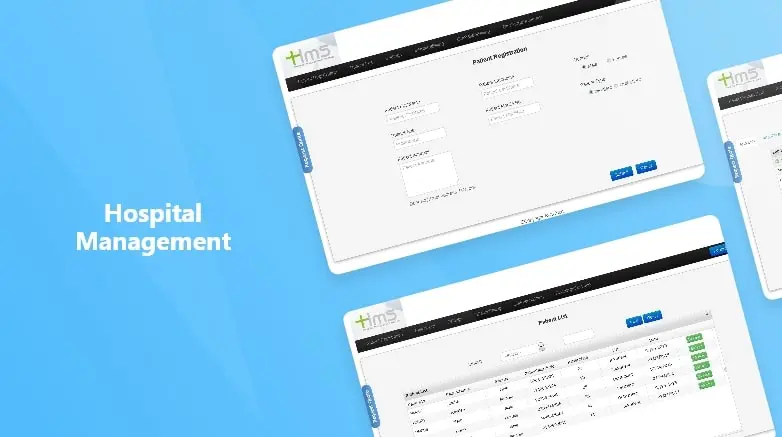
In House Hospital Management System
Healthcare
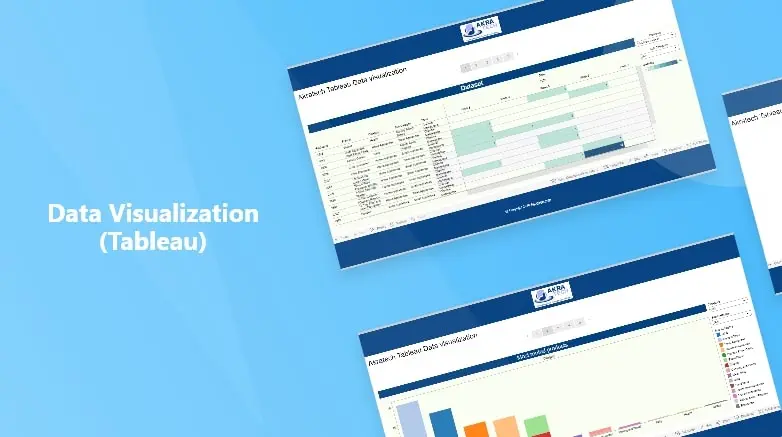
Data Visualisation & Analytics
Data Visualization
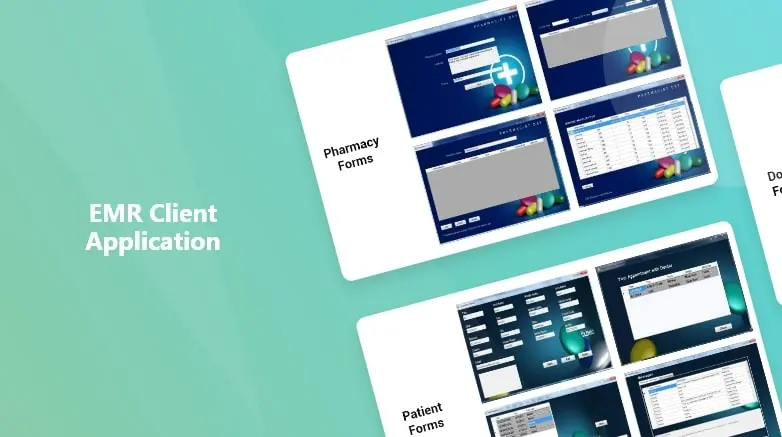
EMR Client Application
Data Visualization
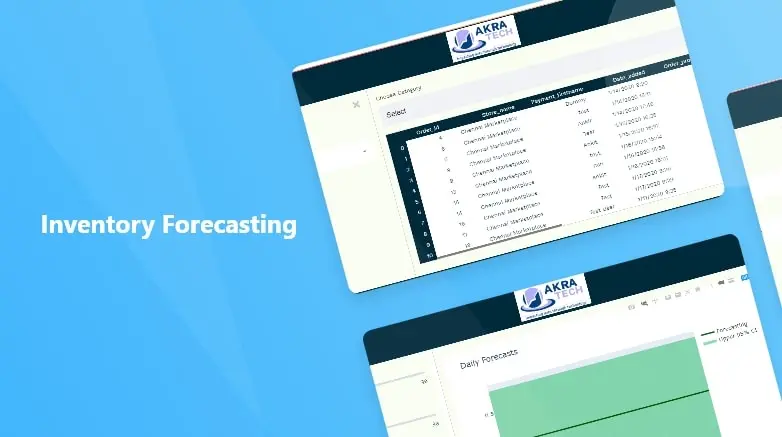
Inventory Forecasting
Data Science
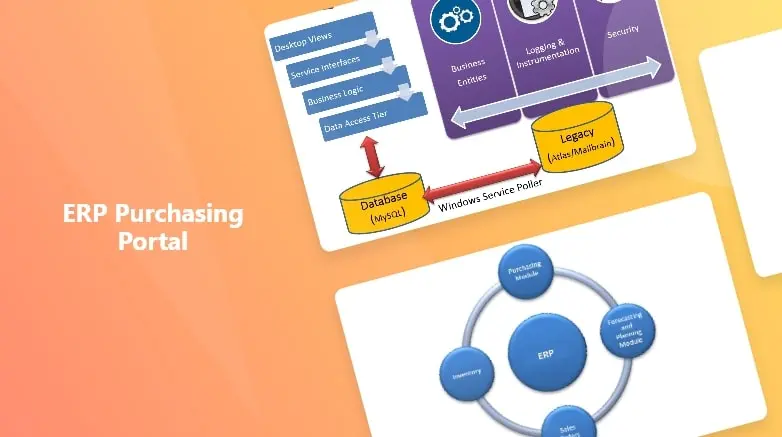
ERP Purchasing Portal
Data Science
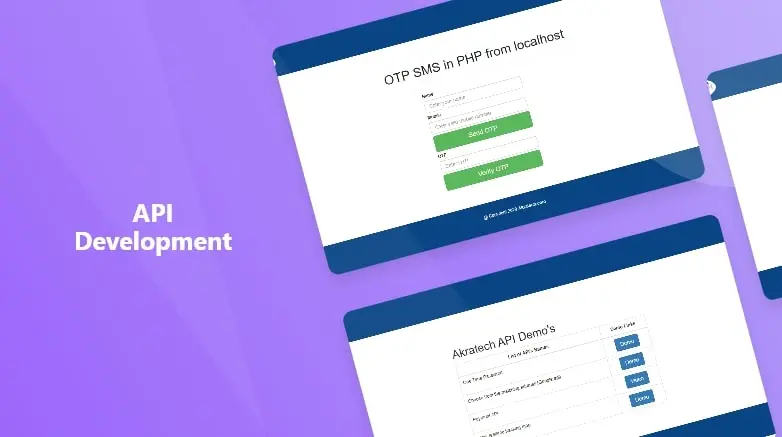
API Development
Data Science

Zoho Integration
Data Science
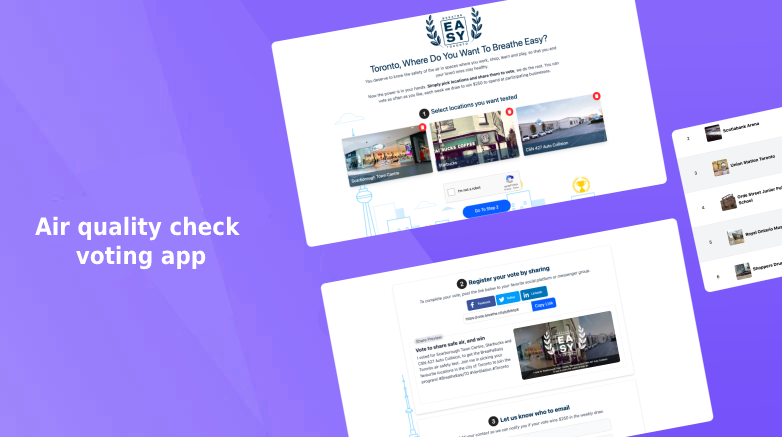
Air Quality Check Voting App
Healthcare
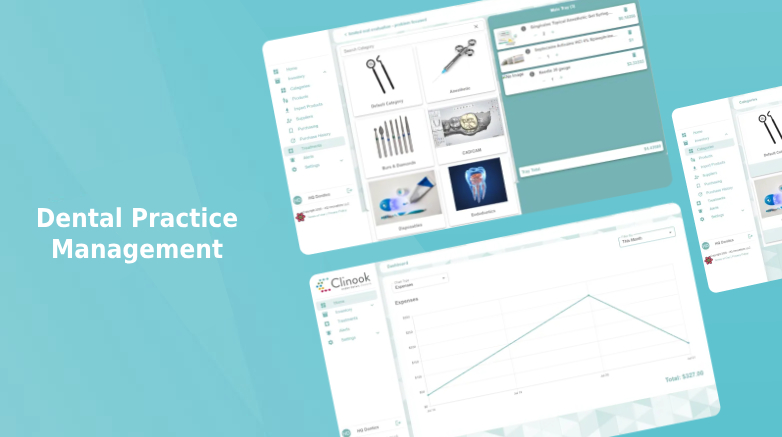
Company Formation Portal
E-commerce
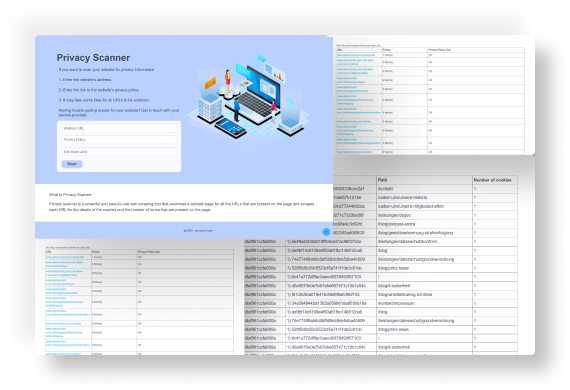
Web Privacy Scanner
SAAS

Delivery Routing Application
Data Science

Visual Forecasting
SAAS

Web Scraping with Python
Data Scraping

Inventory Forecasting
Data Science

Web Scraping with Python
Data Scraping

Data Visualisation & Analytics
Data Visualization

Gift Pool
E-commerce

Company Formation Portal
E-commerce

Database (Backend Management)
Healthcare

Problem Oriented Health Application
Healthcare

Akra Health Tele Medicine App
Healthcare

In House Hospital Management System
Healthcare

Air Quality Check Voting App
Healthcare

Visual Forecasting
SAAS

Web Privacy Scanner
SAAS
